|
Short description and remarks
The Lid Driven Cavity is a model for flow in a cavity where
the upper boundary moves to the right, and thus causes a
rotation in the cavity. The flow at the chosen small Reynolds
number, starting from rest, tends
to some steady behaviour, although the patterns during this
process are quite complex.
This simulation is one of the oldest in the 'Virtual Album',
and it is a student version!
|
|
Visualization
-
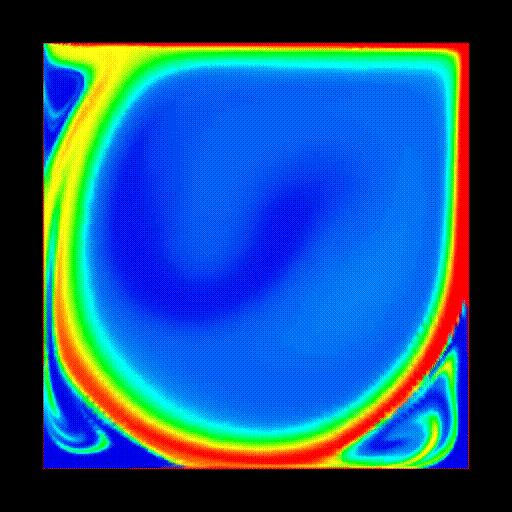
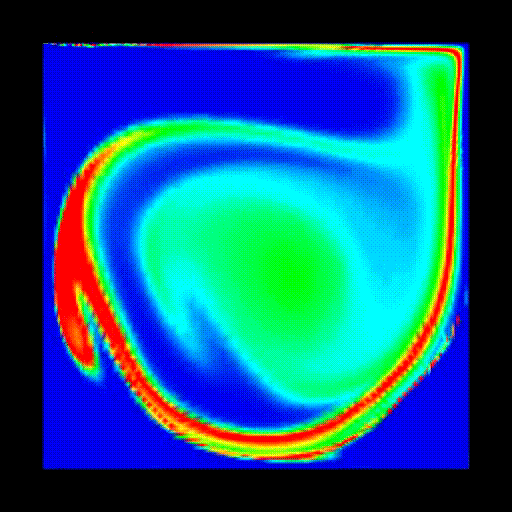
Distribution of temperature/concentration via Boussinesq model
Presented are two visualizations of the distribution of
temperature if the walls are heated to a constant temperature and
the flow field transports this temperature. Since the fluid
is incompressible, this model is equivalent to giving a certain
(constant) concentration of a substance into the flow and
watch the spreading.
Left is shown a visualization which emphasises on the higher
concentration (3.6 MB), while the right one shows better
the fine details in the interior (5.6 MB).
-
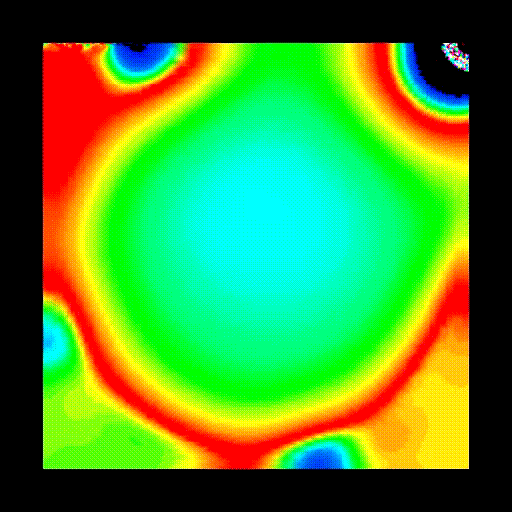
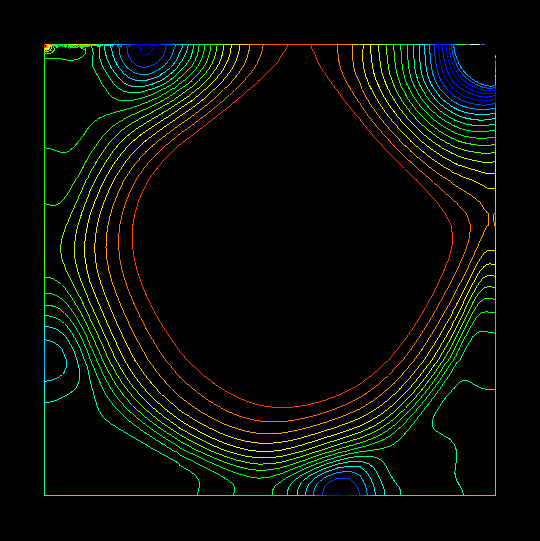
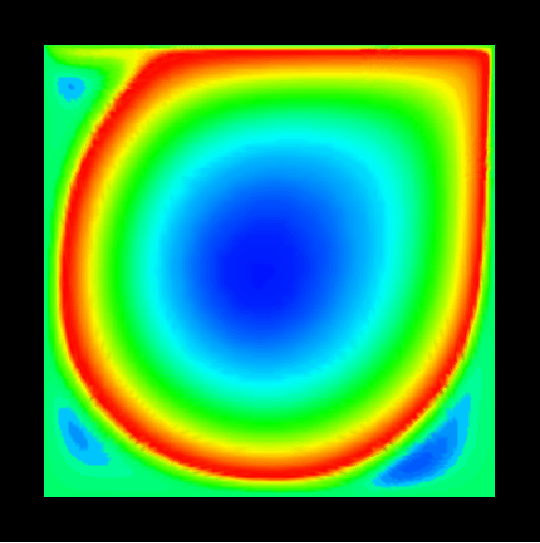
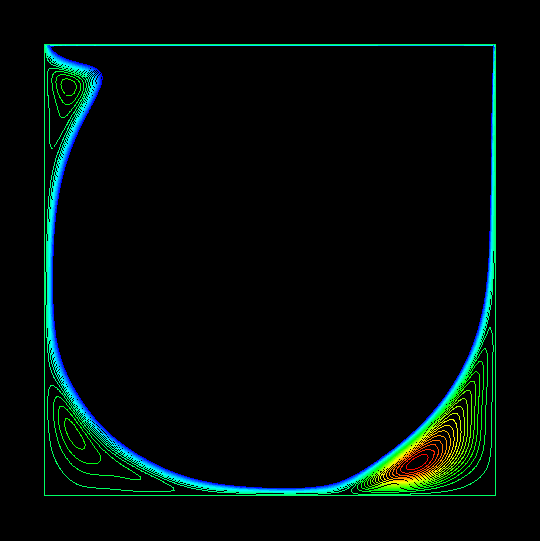
Pressure
Visualization via pressure plots, shaded (first, 3.3 MB) and
via isolines (second, 16 MB). Since there is a singularity at
the upper right (pressure tends to infinity) and the upper
left corner (pressure tends to minus infinity), those areas are
painted in black. Please note that the interior of the
isoline movie ("black
hole") does in fact contain isolines, but that we have
cut out this area in order to emphasize on the outer regions.
-
Streamfunction
Visualization via streamline plots, shaded (first, 2.7 MB)
and via isolines (second, 4.7 MB). For the black region in the
interior of the isolines movie the same applies as for the
pressure plots.
-
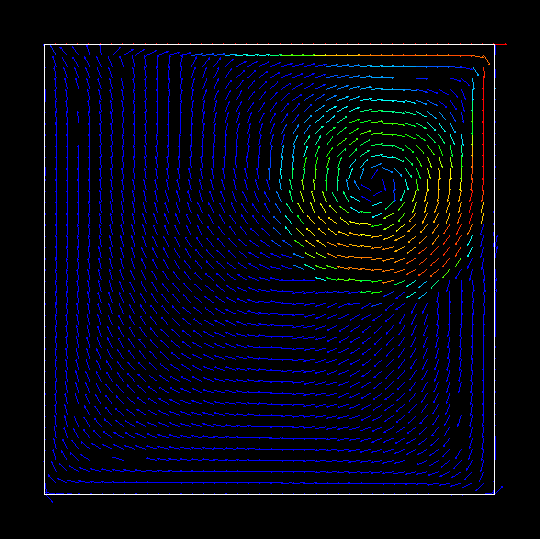
Velocity
Visualization via vector plots (vectors, 12.4 MB). Please
note that the local velocity is only
indicated by the use of colour, not by the length of the
vectors.
|