
Bubble Benchmark
Verification of the results by the picture norm:
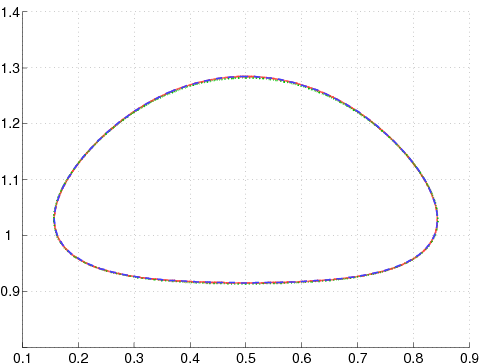
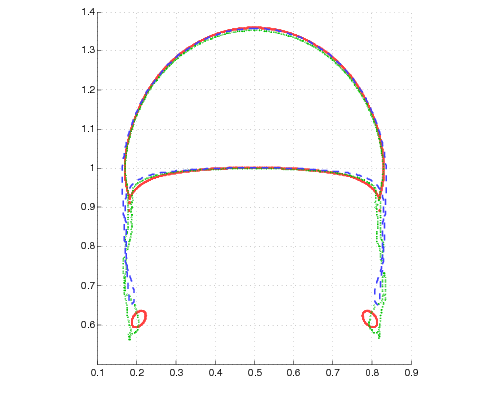
To visually verify the results the following approximate bubble shapes can be used. (The raw data for the bubble shapes can be obtained from the Reference data page.)
- Bubble shapes at the final time (t=3)
- Test case 1
- Test case 2
Verification of the results by quantitative data:
Since mere visual inspection is not really enough to say anything about the accuracy of the simulations the following benchmark quantities have been defined and computed.
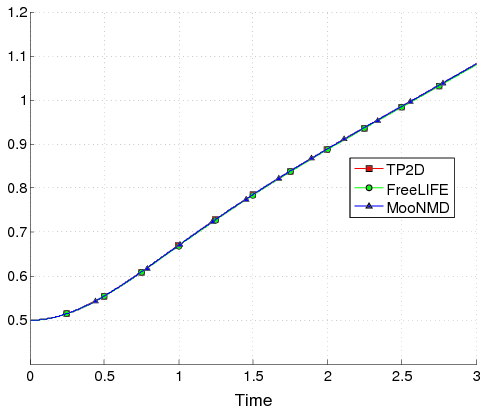
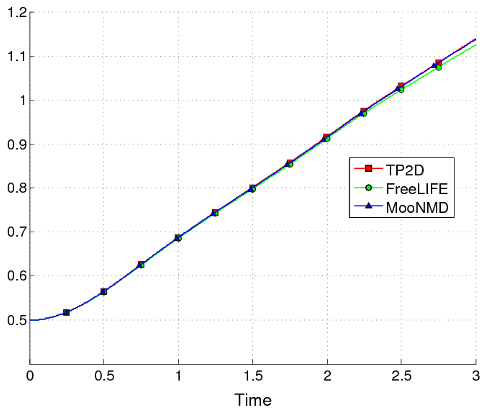
Center of Mass
The centroid or center of mass of the bubble is defined by
= \frac{\int_{\Omega_2} \mathbf{x}\ dx}{\int_{\Omega_2} 1\ dx}\end{displaymath}")
- Center of Mass for all groups
- Test Case 1
- Test Case 2
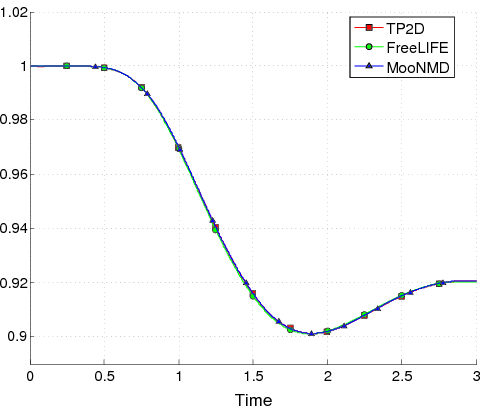
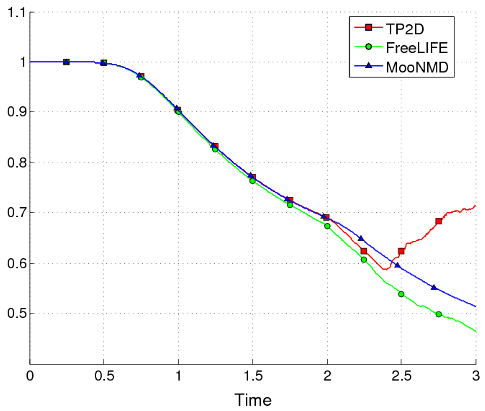
Circularity
The "degree of circularity" in  can be defined as

Here, Pa denotes the perimeter or circumference of a circle with diameter da which has an area equal to that of a bubble with perimeter Pb. For a perfectly circular bubble or drop the circularity will be equal to unity and decrease as the bubble is deformed.
- Circularity for all groups
- Test Case 1
- Test Case 2
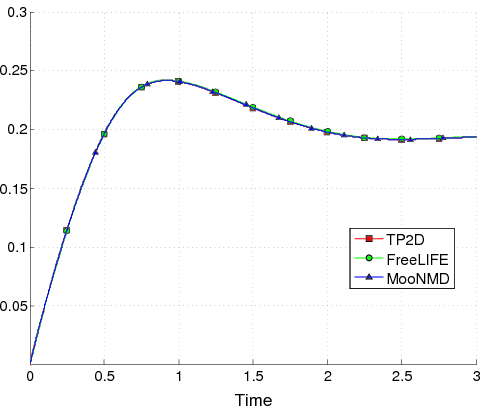
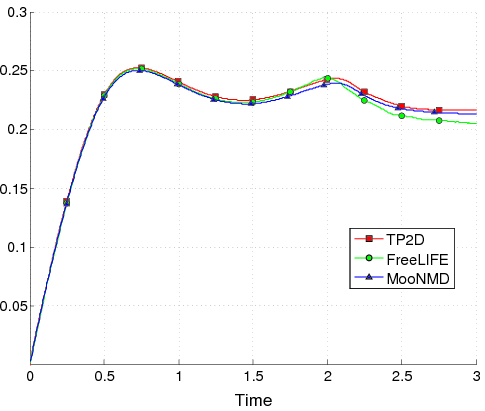
Rise Velocity
The mean velocity with which a bubble is rising or moving is a particularly interesting quantity since it does not only measure how the interface tracking algorithm behaves but also the quality of the overall solution. The mean bubble velocity is defined as

- Rise velocity for all groups
- Test case 1
- Test case 2
Continue reading: