Results
The benchmark problems studied with all the codes, and while the problems were being studied, the question was not: "Is the software tool capable of solving the problem?" but "How accurate and efficient is the given software tool?". Therefore, to show the accuracy of the employed CFD softwares, the benchmark problem at Re=20 is firstly studied. The results for this case obtained for 4 different mesh levels are given here.
| # of Cells | Software | cD | cL | %Err cD | %Err cL |
|---|---|---|---|---|---|
| L1 | CFX | 6.06750 | 0.01255 | 1.91 | 33 |
| 6144 | OF | 6.13408 | 0.01734 | 0.83 | 84 |
| FeatFlow | 6.13973 | 0.00956 | 0.74 | 1.8 | |
| L2 | CFX | 6.13453 | 0.00817 | 0.82 | 14 |
| 49152 | OF | 6.19702 | 0.01099 | 0.19 | 17 |
| FeatFlow | 6.17433 | 0.009381 | 0.18 | 0.21 | |
| L3 | CFX | 6.17481 | 0.00928 | 0.17 | 1.3 |
| 393216 | OF | 6.19362 | 0.01001 | 0.13 | 6.5 |
| FeatFlow | 6.18260 | 0.009387 | 0.04 | 0.15 | |
| L4 | CFX | 6.18287 | 0.009387 | 0.04 | 0.15 |
| 3145728 | OF | 6.18931 | 0.00973 | 0.06 | 3.5 |
| FeatFlow | 6.18465 | 0.009397 | 0.01 | 0.05 |
The qualitative results were indistinguishable even for the coarsest level calculations for the Re=20 test case.
The expected agreement of the results for the first benchmark test motivated us to go on with the second benchmark problem which is the challenging part of our benchmarking studies. The second benchmark problem has a fixed simulation time, T=8 s, whereas the first benchmark problem is simulated towards the steady state solution. There is no precise unique definition of the stopping criteria for all the softwares for the first case. Therefore, while the software tools are compared with respect to their accuracy in both cases, their computational performance has been tested in the later case, as well. The coarse grid computations were performed sequentially and fine grid ones were done in parallel, based on domain decomposition method. Both sequential and parallel computations were performed on identical compute nodes: Dual-core AMD Opteron™ Processor 250 2.4 GHz with 8 GB total memory. To decrease the latency time due to memory bandwidth limitation each partition is submitted to one node. The nodes were interconnected via 1GHz ethernet connection, regarding the number of nodes it is a sufficiently fast connection. However, it has to be mentioned that the performance of the software packages will increase for higher number of partitions by using infiniband connected nodes.
In the second benchmark test, the flow is simulated for 8 seconds, a half period of the imposed inflow condition. The simulations start with zero inflow and zero initial condition at t=0 s and finish at t=8 s with zero inflow again, see (3). Due to the transient inflow condition, adaptive time stepping technique is a good candidate for this problem. However, in preliminary studies with this technique, numerical oscillations are observed in the results which are obtained by CFX and OpenFOAM. The oscillations were nor visible in qualitative results neither in the drag coefficient results. However, when the results of a sensitive variable such as cL are plotted, the numerical oscillations appear. The results are obtained on a mesh with 393216 cells by OpenFOAM for two different values of maximum Courant numbers, maxCo, and with different tolerance values of linear solvers. Tolerance values of the velocity solver, uTol, are set to 10-5 or 10-6 and tolerance values of the pressure solver, pTol, are set to 10-6 or 10-7.
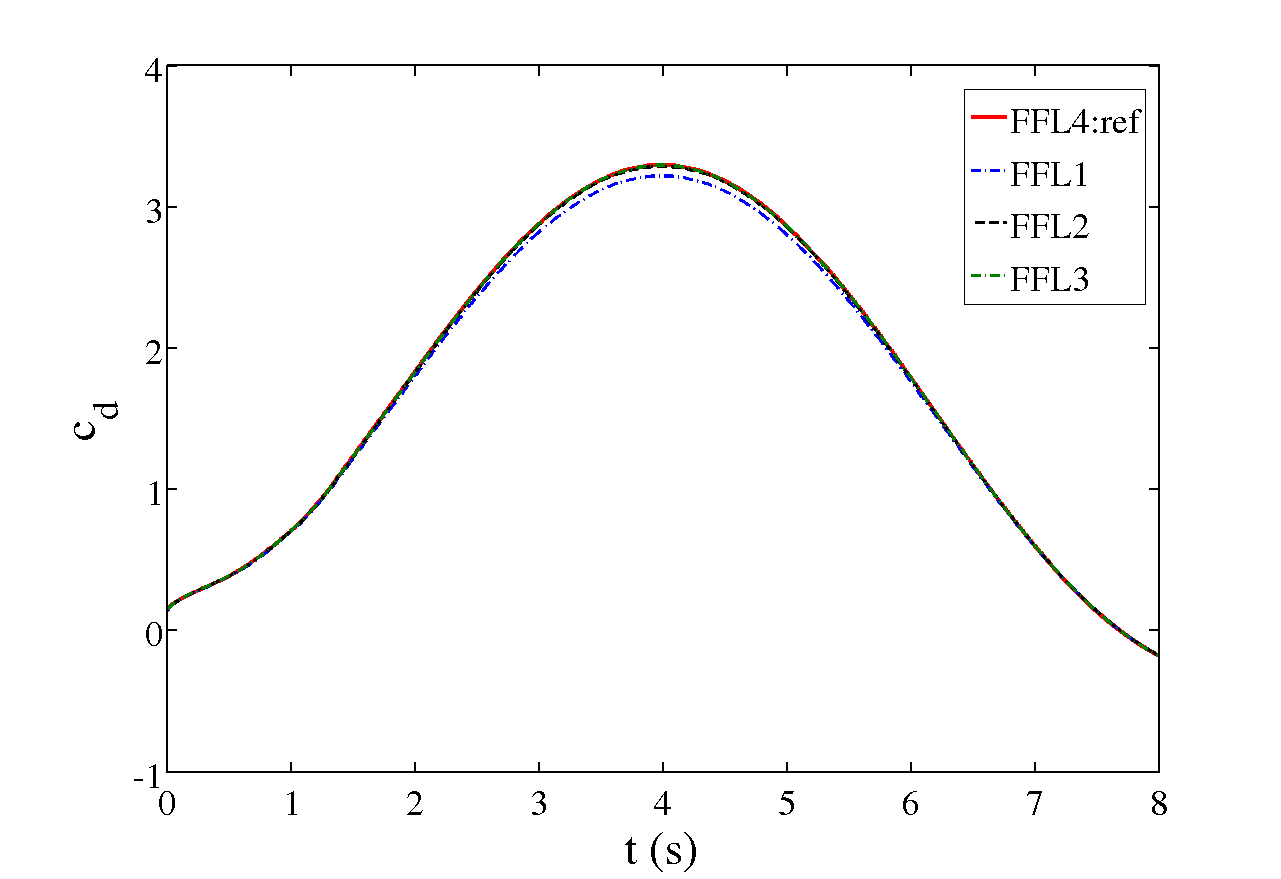
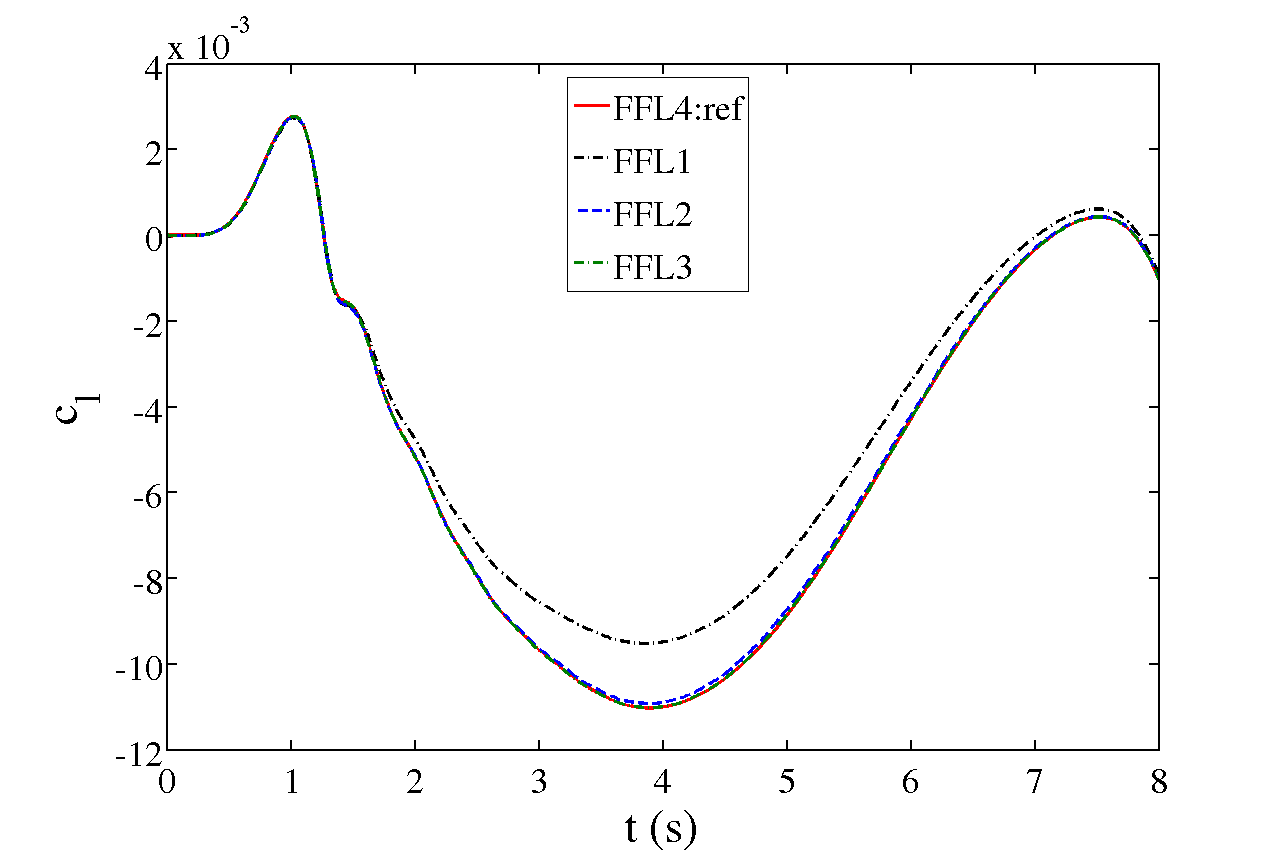
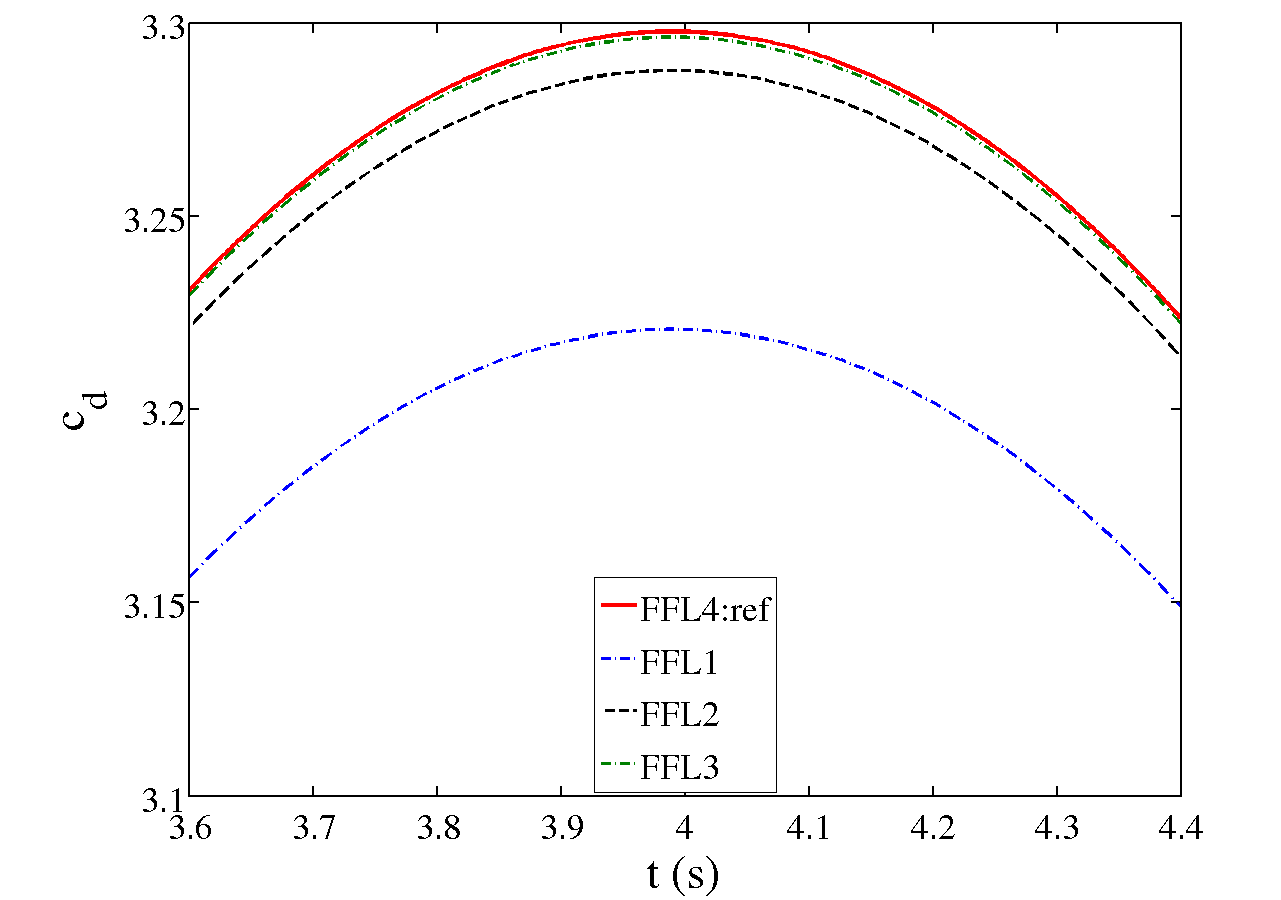
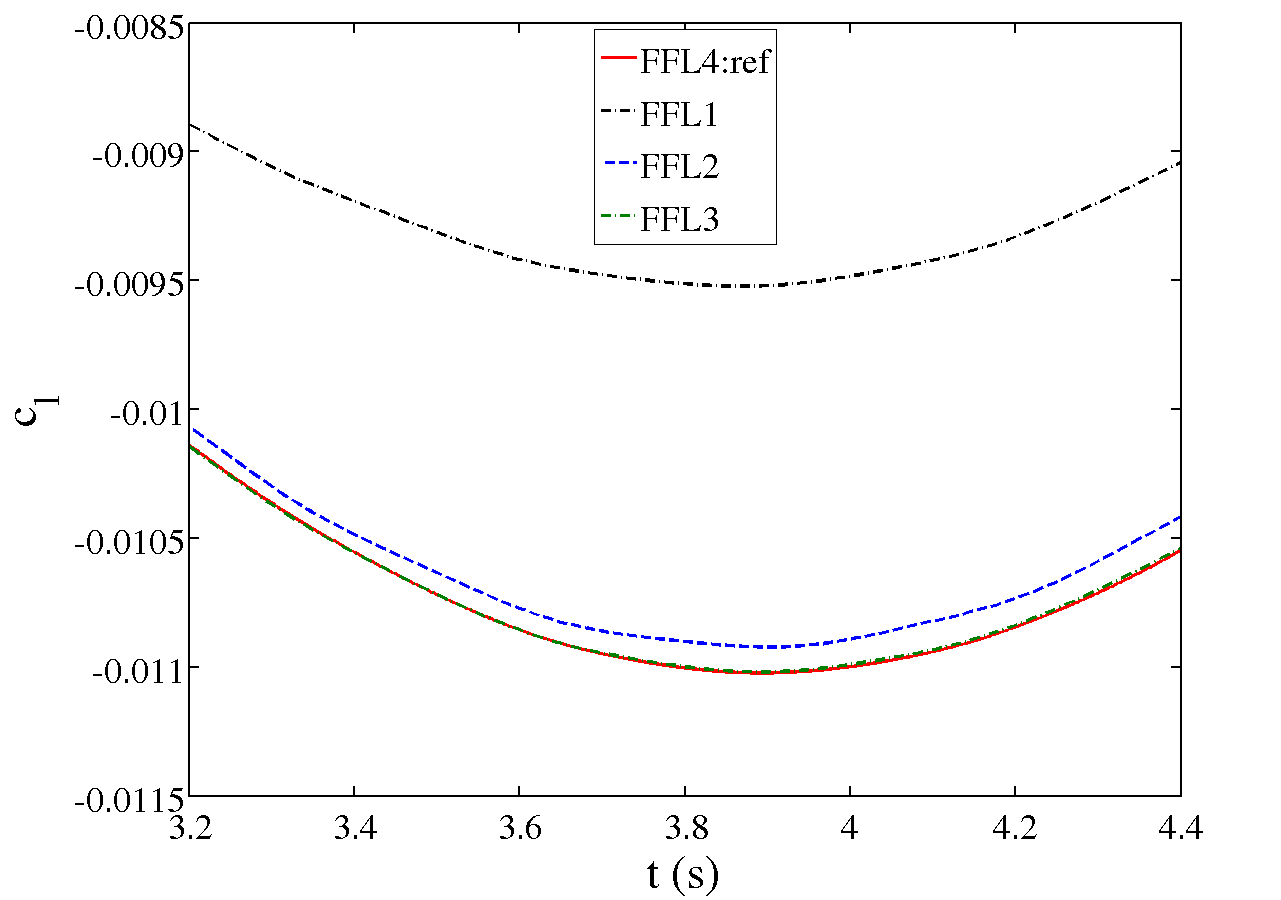
Therefore, a fixed time step size is used in the simulations although it leads to excess of computational costs. The benchmark calculations are performed on several levels of refined meshes to obtain mesh independent results and to show convergence of the solvers with respect to the mesh size. The chosen time step sizes are maximum values for which the solution is independent of the chosen time step size. The comparison criteria are maximum drag coefficient and minimum lift coefficient. Since the lift coefficient is more sensitive than the drag coefficient, the lift coefficient results are more representative in accuracy. When all the results are considered, it is clear that FeatFlow has the best convergence behavior, namely showing quadratic convergence, with respect to the mesh size. This result was foreseen by the authors due to the employed quadratic finite element functions. And converged results with respect to mesh size are already obtained on the 3rd level mesh by FeatFlow. In the plot, it is clearly shown that level 3 and level 4 results are identical and consequently the finest level results are considered as the reference through this study. Moreover, it is worth to mention that these results are the closest to one reported by John.


The old results for cDmax and cLmin had been given within the intervals, [3.2000,3.3000] and [0.0020,0.0040] respectively, by Turek et al., and cDmax has been determined as 3.2968 by John. These old results are not sufficient and accurate enough to establish an inclusive benchmark study. Besides, to evaluate the results of benchmark calculations with respect to only cDmax and cLmin is not much elucidating on the accuracy of the results. Hence, additional to the comparison of cDmax and cLmin values, we also compare the solution regarding L2Err and L_∞Err which denotes the L2 norm of the error normalized by L2 norm of the reference solution and the L∞ norm of error, respectively, are obtained through the following calculation steps:
- An equidistant discrete time step is specified for which L2Err is independent of the step size.
- The reference solution and the other solutions are interpolated (linear interpolation) to the specified discrete time step.
- L2 norm and L∞ norm of the differences between reference solution and other solutions are calculated.
Results of the benchmark calculations for FeatFlow are plotted here. Values of the comparison criteria, L2Err, L∞Err and relative errors due to the comparison criteria are given here and here.
The finest level results are presented in the table below; the second table compares the relative errors. It is obvious that the results are in agreement. An interesting finding is that the FeatFlow results at level 2 are as accurate as results of CFX or OpenFOAM at the finest level.
FeatFlow
| Case | # of Cells | cDmax | cLmax | cLmin | Tstep (s) | Time (s) |
|---|---|---|---|---|---|---|
| FFL1 | 6144 | 3.2207 | 0.0027 | -0.0095 | 0.010 | 3220 × 2 |
| FFL2 | 49152 | 3.2877 | 0.0028 | -0.010892 | 0.010 | 17300 × 4 |
| FFL3 | 393216 | 3.2963 | 0.0028 | -0.010992 | 0.010 | 35550 × 24 |
| FFL4 | 3145728 | 3.2978 | 0.0028 | -0.010999 | 0.005 | 214473 × 48 |
| %Err | %L2Err | %L∞Err | ||||
|---|---|---|---|---|---|---|
| Case | cDmax | cLmin | cD | cL | cD | cL |
| FFL1 | 2.34 | 13.6 | 2.09 | 13.8 | 7.71 | 0.152 |
| FFL2 | 0.31 | 0.91 | 0.29 | 1.05 | 1.01 | 0.013 |
| FFL3 | 0.05 | 0.09 | 0.06 | 0.28 | 0.23 | 0.003 |
OpenFoam
| Case | # of Cells | cDmax | cLmax | cLmin | Tstep (s) | Time (s) |
|---|---|---|---|---|---|---|
| OFL2 | 49152 | 3.33963 | 0.0029 | -0.0128 | 0.0025 | 4850 |
| OFL3 | 393216 | 3.3233 | 0.0028 | -0.0118 | 0.0010 | 76300 × 4 |
| OFL4 | 3145728 | 3.3038 | 0.0012 | -0.0112 | 0.005 | 593500 × 24 |
| %Err | %L2Err | %L∞Err | ||||
|---|---|---|---|---|---|---|
| Case | cDmax | cLmin | cD | cL | cD | cL |
| OFL2 | 3.0 | 16 | 2.61 | 14.5 | 10.0 | 0.21 |
| OFL3 | 0.8 | 7.3 | 0.67 | 5.91 | 2.56 | 0.08 |
| OFL4 | 0.2 | 1.8 | 0.16 | 1.47 | 0.61 | 0.02 |
CFX
| Case | # of Cells | cDmax | cLmax | cLmin | Tstep (s) | Time (s) |
|---|---|---|---|---|---|---|
| CFXL2 | 49152 | 3.3336 | 0.0028 | -0.0106 | 0.010 | 22320 |
| CFXL3 | 393216 | 3.3334 | 0.0028 | -0.0118 | 0.005 | 61530 × 4 |
| CFXL4 | 3145728 | 3.3084 | 0.0028 | -0.0113 | 0.005 | 115300 × 24 |
| %Err | %L2Err | %L∞Err | ||||
|---|---|---|---|---|---|---|
| Case | cDmax | cLmin | cD | cL | cD | cL |
| CFXL2 | 1.1 | 3.63 | 1.52 | 7.81 | 5.31 | 0.10 |
| CFXL3 | 1.1 | 7.27 | 0.98 | 6.31 | 3.75 | 0.10 |
| CFXL4 | 0.3 | 2.73 | 0.29 | 2.24 | 1.20 | 0.03 |
Comparison of the results
| Case | # of Cells | cDmax | cLmax | cLmin | Tstep (s) | Time (s) |
|---|---|---|---|---|---|---|
| FFL2 | 49152 | 3.2877 | 0.0028 | -0.010892 | 0.010 | 17300 × 4 |
| FFL4 | 3145728 | 3.2978 | 0.0028 | -0.010999 | 0.005 | 214473 × 48 |
| OFL4 | 3145728 | 3.3038 | 0.0012 | -0.0112 | 0.005 | 593500 × 24 |
| CFXL4 | 3145728 | 3.3084 | 0.0028 | -0.0113 | 0.005 | 115300 × 24 |
| %Err | %L2Err | %L∞Err | ||||
|---|---|---|---|---|---|---|
| Case | cDmax | cLmin | cD | cL | cD | cL |
| FFL2 | 0.31 | 0.91 | 0.29 | 1.05 | 1.01 | 0.013 |
| OFL4 | 0.2 | 1.8 | 0.16 | 1.47 | 0.61 | 0.02 |
| CFXL4 | 0.3 | 2.73 | 0.29 | 2.24 | 1.20 | 0.03 |
