|
|
"Moving flaps" for different flow configurations
|
|
|
|
Computational details
|
|
|
Short description and remarks
|
|
|
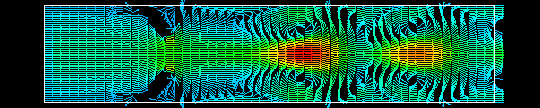
Visualization via velocity plots
|
|
|
|
|
Short description and remarks
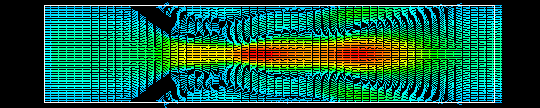
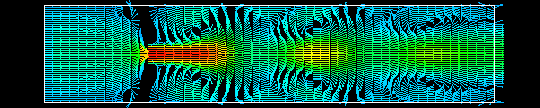
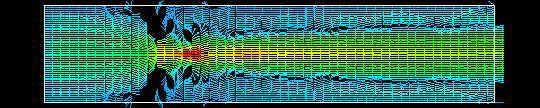
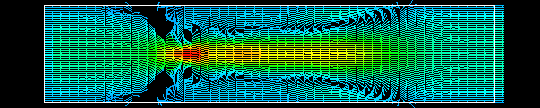
The following simulation addresses the problem of
two-dimensional
channel flow around two moving flaps. From the left side,
a parabolic flow
of different velocity magnitude (v=1 or 4) is injected.
The movement of the flaps is explicitly prescribed to be
periodic and
continuous, its angular velocity w being in the range of
w=0.5 up to w=8.
The flaps are moving with the same speed and
can overlap with
the channel walls. The minimum distance between the
flaps is 0.6
as compared to the total channel height of 3. The movement
of the flaps is
prescribed by the "Fictitious Boundary Conditions" only: All
calculations
are performed on ONE SINGLE mesh! Due to the nature of the
calculation,
it is difficult to visualize streamfunction and pressure
plots because
of possible singularities at the boundaries. Therefore, only
velocity plots are
presented here. The simulation is a pre-study for a planned
simulation of
heart flap movement and was performed as part of an advanced
laboratory
study ("Fortgeschrittenen-Praktikum") at Heidelberg 1998 by
the author of this document and by S. Turek.
Click
here
for some detailed comparisons of the simulated
configurations. All simulations were done on
level 6 unless noted otherwise.
The angular velocity of the flaps (in multiples of Pi) is
denoted by "w" , while the inflow velocity is denoted by "v".
|
|
|
|
|
|
Visualization via velocity plots
|
|
|
|
|
|
Please send any comments and suggestions to: featflow@featflow.de |
|