
Bubble Benchmark
Geometry and flow configurations:
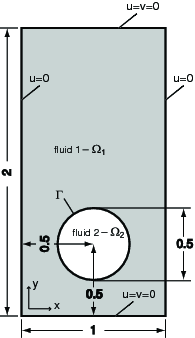
The initial configuration, see the figure below, is identical for both test cases and consists of a circular bubble of radius r0 = 0.25 centered at (x,y) = (0.5, 0.5) in a 1 by 2 rectangular domain. The density of the bubble is smaller than that of the surrounding fluid (ρ2<ρ1). The no-slip boundary condition (u = 0) is used at the top and bottom boundaries, whereas the free slip condition ( ,
, ^T)\cdot \hat{\mathbf{n}}=0$") ,
,  - the tangent vector) is imposed on the vertical walls.
Initial configuration and boundary conditions for the test cases
The table below lists the fluid and physical parameters which specify the test cases. The evolution of the bubbles should be tracked for 3 time units during which the defined benchmark quantities should be measured. The first test case models a rising bubble with Reynolds number Re=35, Eötvös number Eo=10, and both density and viscosity ratios equal to 10. The second and more challenging test case models a rising bubble with Re=35, Eo=125, and with large density and viscosity ratios (1000 and 100).
Continue reading: